Validation against Reference Data Set
Source:vignettes/articles/sdarr_validation.Rmd
sdarr_validation.RmdThough no exhaustive validation has been conducted, the Reference Data Set E3076-DS1(2018) File 01 mentioned in ASTM E3076-18 as …available for download from ASTM… has been used to check the results of this implementation. The Reference Data Set E3076-DS1(2018) File 01 was also analyzed as benchmark in NIST Technical Note 2050 by E. Lucon with minor differences to the expected results listed in the standard.
Reference Data Set
A plot of the Reference Data Set (after downloading, unpacking and labeling) for validation of the Slope Determination by Analysis of Residuals (SDAR) algorithm is given below.
Validation of the standard SDAR-algorithm (sdar)
# Run the algorithm
sdar_result <- E3076_DS1_2018 %>%
  sdar(extensometer, force,
    plot = FALSE, plotFun = TRUE)
#> Determination of Slope in the Linear Region of a Test Record:
#> SDAR-algorithm
#>   Data Quality Metric: Digital Resolution
#>     x
#>       Relative x-Resolution:   0.666666666666667
#>       % at this resolution:    15.5963302752294
#>       % in zeroth bin:         6.42201834862385
#>       --> pass
#>     y
#>       Relative y-Resolution:   0.333333333333333
#>       % at this resolution:    4.58715596330275
#>       % in zeroth bin:         90.8256880733945
#>       --> pass
#>   Data Quality Metric: Noise
#>     x
#>       Relative x-Noise:        0.325118923848699
#>       --> pass
#>     y
#>       Relative y-Noise:        0.14437695453926
#>       --> pass
#>   Fit Quality Metric: Curvature
#>     1st Quartile
#>       Relative Residual Slope: 0.366359693308656
#>       Number of Points:        25
#>       --> pass
#>     4th Quartile
#>       Relative Residual Slope: 0.205348930211828
#>       Number of Points:        25
#>       --> pass
#>   Fit Quality Metric: Fit Range
#>       relative fit range:      0.925620787205303
#>       --> pass
#>   Un-normalized fit
#>       Final Slope:             328.108508087124 kN/mm
#>       True Intercept:          -0.0376051859940911 kN
#>       y-Range:                 5.456632 kN - 14.35957 kN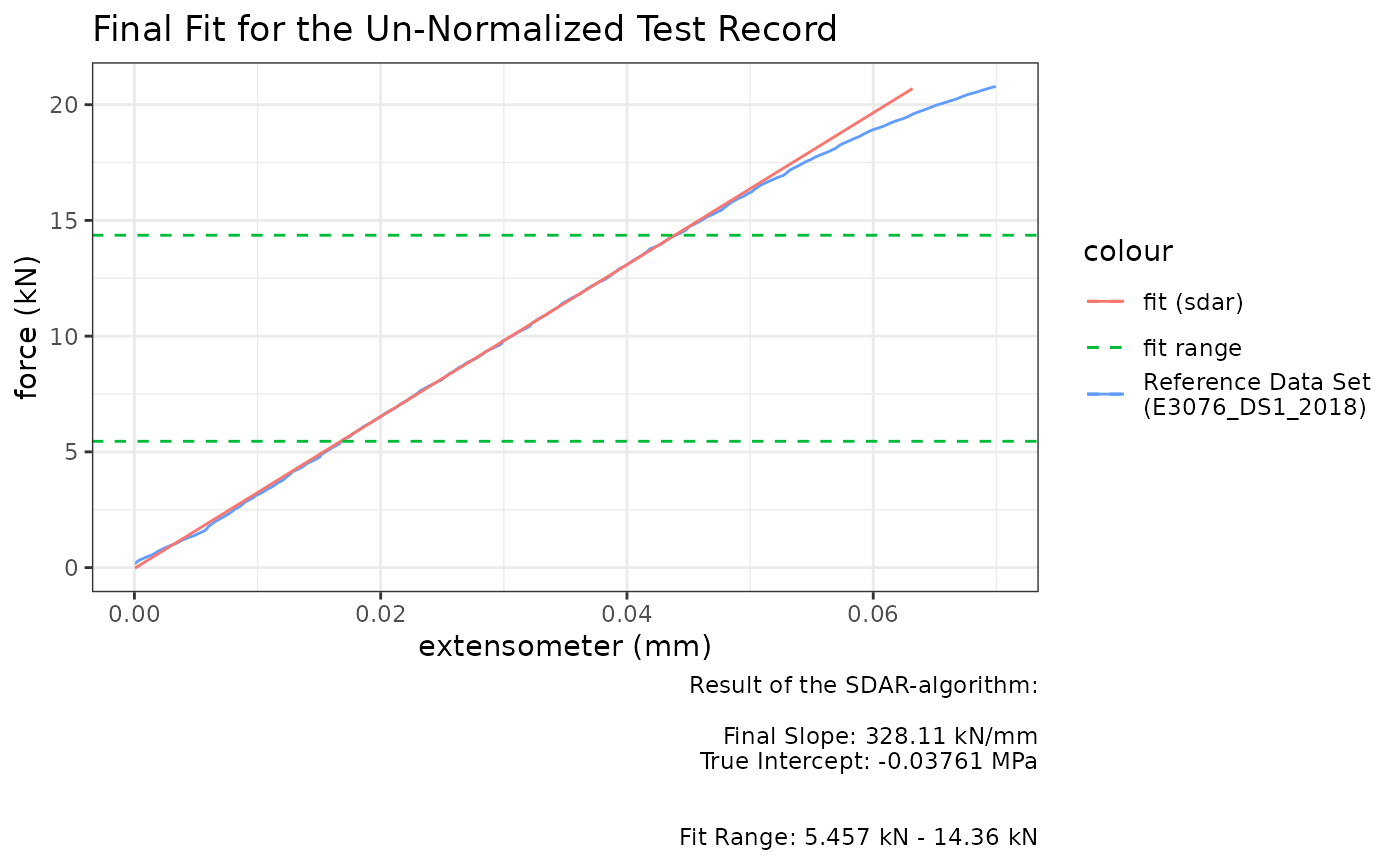
Validation Result of the standard SDAR-algorithm (sdar)
The results (see the verbose
messages and table 1) of the analysis using sdar() are
practically identical to the results given in ASTM E3076-18 and perfectly
match the results from NIST Technical Note 2050 by
E. Lucon (except for omitting any rounding). As stated in NIST Technical Note 2050 by
E. Lucon …The few small discrepancies are most likely
attributable to rounding errors….
| Parameter/result | ASTM E3076 | Excel spreadsheet | sdar |
|---|---|---|---|
| Relative x-resolution | 0.67 | 0.67 | 0.67 |
| Relative y-resolution | 0.33 | 0.33 | 0.33 |
| Relative x-noise | 0.325 | 0.325 | 0.325 |
| Relative y-noise | 0.144 | 0.144 | 0.144 |
| 1st Quartile relative residual slope | 0.366 | 0.366 | 0.366 |
| 4th Quartile relative residual slope | 0.205 | 0.205 | 0.205 |
| Relative Fit Range | 0.92565 | 0.92562 | 0.92562 |
| Final Slope (in kN/mm) | 328.10 | 328.11 | 328.11 |
| True Intercept (in kN) | -0.03761 | -0.03761 | -0.03761 |
| Lower y bound of fit range (in kN) | 5.457 | 5.457 | 5.457 |
| Upper y bound of fit range (in kN) | 14.36 | 14.36 | 14.36 |
Validation of the Random Sub-sampling Modification of the SDAR-algorithm (sdar_lazy)
# Run the algorithm (after setting a random seed)
set.seed(50041180)
# As the data set is rather short, the algorithm might refuse to use
# the random sub-sampling as it will require more computational effort.
# Enforce by setting enforce_subsampling = TRUE.

lazy_result <- E3076_DS1_2018 %>%
  sdar_lazy(extensometer, force,
    plot = FALSE, plotFun = TRUE,
    enforce_subsampling = TRUE)
#> Determination of Slope in the Linear Region of a Test Record:
#> Random sub-sampling modification of the SDAR-algorithm
#>   Random sub-sampling information:
#>       83 points of 220 points in the normalized range were used.
#>       0 % of the sub-samples passed the data quality checks.
#>       72 % of the sub-samples passed the fit quality checks.
#>       0 % of the sub-samples passed all quality checks.
#>
#>   Data Quality Metric: Digital Resolution
#>     x
#>       Relative x-Resolution:   0.666666666666667
#>       % at this resolution:    15.5963302752294
#>       % in zeroth bin:         6.42201834862385
#>       --> pass
#>     y
#>       Relative y-Resolution:   0.333333333333333
#>       % at this resolution:    4.58715596330275
#>       % in zeroth bin:         90.8256880733945
#>       --> pass
#>   Data Quality Metric: Noise
#>     x
#>       Relative x-Noise:        0.325118923848699
#>       --> pass
#>     y
#>       Relative y-Noise:        0.14437695453926
#>       --> pass
#>   Fit Quality Metric: Curvature
#>     1st Quartile
#>       Relative Residual Slope: 0.385319540604674
#>       Number of Points:        25
#>       --> pass
#>     4th Quartile
#>       Relative Residual Slope: -0.0711761723808788
#>       Number of Points:        23
#>       --> pass
#>   Fit Quality Metric: Fit Range
#>       relative fit range:      0.914927986462066
#>       --> pass
#>   Un-normalized fit
#>       Final Slope:             327.758533115795 kN/mm
#>       True Intercept:          -0.0279149776265081 kN
#>       y-Range:                 5.551003 kN - 14.55799 kN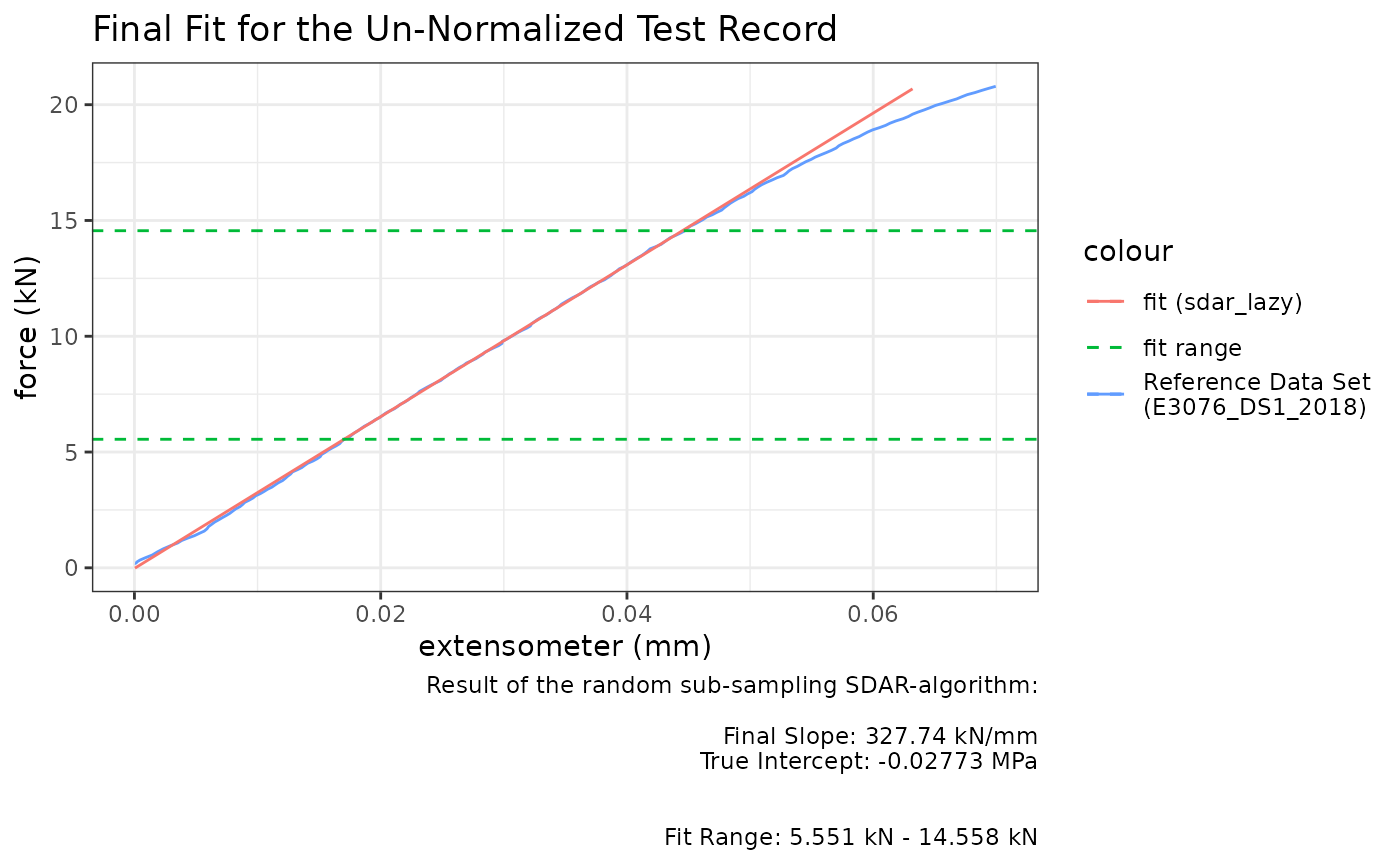
Validation Result of the Random Sub-sampling Modification of the SDAR-algorithm (sdar_lazy)
At first glimpse, the results (see the verbose messages and table 2) of the
analysis using the random sub-sampling variant of the SDAR-algorithm
sdar_lazy() are not identical to the results given in ASTM E3076-18 or the results
from NIST Technical Note
2050 by E. Lucon.
However, when considering the 95% confidence interval of the final
fitting (not mentioned in the ASTM E3076, but additionally calculated
from the final linear regression of the data in sdar() and
sdar_lazy()). The final slope of the lazy variant (327.74
kN/mm) is well in line with the standard variant (95%-CI: [327.44 kn/mm,
328.78 kN/mm]). Similarly, the true intercept of the lazy variant (-27.7
N) is well in line with the standard variant (95%-CI: [-58.7 N, -16.5
N]).
As the fitting range is estimated prior to finding a linear regression
in sdar_lazy(), there is a minor difference in the y-range
of the final fits that is resulting in slightly deviating final results.
Comparing the regression curves of sdar_lazy() and
sdar() in the plot below (plotted with the 95%-CI from
sdar()), you see that there is practically no difference
(zoom in …a lot… to see a difference).
| Parameter/result | ASTM E3076 | Excel spreadsheet | sdar_lazy |
|---|---|---|---|
| Relative x-resolution | 0.67 | 0.67 | 0.67 |
| Relative y-resolution | 0.33 | 0.33 | 0.33 |
| Relative x-noise | 0.325 | 0.325 | 0.325 |
| Relative y-noise | 0.144 | 0.144 | 0.144 |
| 1st Quartile relative residual slope | 0.366 | 0.366 | 0.385 |
| 4th Quartile relative residual slope | 0.205 | 0.205 | -0.071 |
| Relative Fit Range | 0.92565 | 0.92562 | 0.91493 |
| Final Slope (in kN/mm) | 328.10 | 328.11 | 327.74 |
| True Intercept (in kN) | -0.03761 | -0.03761 | -0.02773 |
| Lower y bound of fit range (in kN) | 5.457 | 5.457 | 5.551 |
| Upper y bound of fit range (in kN) | 14.36 | 14.36 | 14.558 |
Conclusions
Even though this is more a benchmarking than a real
validation, the results of sdar() are practically identical
to the results listed in ASTM
E3076-18 and in NIST
Technical Note 2050 by E. Lucon. Considering the 95% confidence
intervals of the fitting results, same seems true for the random
sub-sampling modification used in sdar_lazy().
Final Remark
Even though the functions within this package have been tested, see the remark in the LICENSE…
THE SOFTWARE IS PROVIDED “AS IS”, WITHOUT WARRANTY OF ANY KIND, EXPRESS OR IMPLIED, INCLUDING BUT NOT LIMITED TO THE WARRANTIES OF MERCHANTABILITY, FITNESS FOR A PARTICULAR PURPOSE AND NONINFRINGEMENT. IN NO EVENT SHALL THE AUTHORS OR COPYRIGHT HOLDERS BE LIABLE FOR ANY CLAIM, DAMAGES OR OTHER LIABILITY, WHETHER IN AN ACTION OF CONTRACT, TORT OR OTHERWISE, ARISING FROM, OUT OF OR IN CONNECTION WITH THE SOFTWARE OR THE USE OR OTHER DEALINGS IN THE SOFTWARE.